Simplifying and re-using
Complex programming is beyond the scope of this guide, but if you sometimes find yourself repeating the same piece of code over and over then it might be worth writing a simple function.
The examples shown in this book are mostly very simple, and are typically not repetitive. However in running your own analyses you may find that you start to repeat chunks of code in a number of places (even across many files).
Not only is this sort of copying-and-pasting tedious, it can be hard to read and maintain. For example, if you are repeating the same analysis for multiple variables and discover an error in your calculations you would have to fix this is in multiple places in your code. You can also introduce errors when copying and pasting code in this way, and these can be hard to spot.
The sorts of tasks which can end up being repetitive include:
- Running models
- Extracting results from models you run
- Producing tables
- Specifying output settings for graphs
In these cases it might be worth writing your own function to facilitate this
repetition, or use some other forms of code re-use (e.g. see the
example for ggplot graphics below).
Writing helper functions
For example, in the section on logistic regression
we wrote a helper function called logistic()
which was simply a shortcut for glm() but with the correct ‘family’ argument
pre-specified.
For more information on writing your own R functions I recommend Hadley Wickham’s ‘R for Data Scientists’, chapter 19 and, if necessary, ‘Advanced R’: http://adv-r.had.co.nz.
Or you prefer a book, try @grolemund2014hands.
Re-using code with ggplot
Another common case where we might want to re-use code is when we produce a number of similar plots, and where we might want to re-use many of the same settings.
Sometimes repeating plots is best achieved by creating a single long-form dataframe and facetting the plot. However this may not always be possible or desireable. Lets say we have two plots like these:
plot.mpg <- mtcars %>%
    ggplot(aes(factor(cyl), mpg)) +
    geom_boxplot()

plot.wt <- mtcars %>%
    ggplot(aes(factor(cyl), wt)) +
    geom_boxplot()
And we want to add consistent labels and other settings to them. We can simply type:
myplotsettings <- xlab("Number of cylinders")And then we simply add (+) these settings to each plot:
plot.mpg + myplotsettings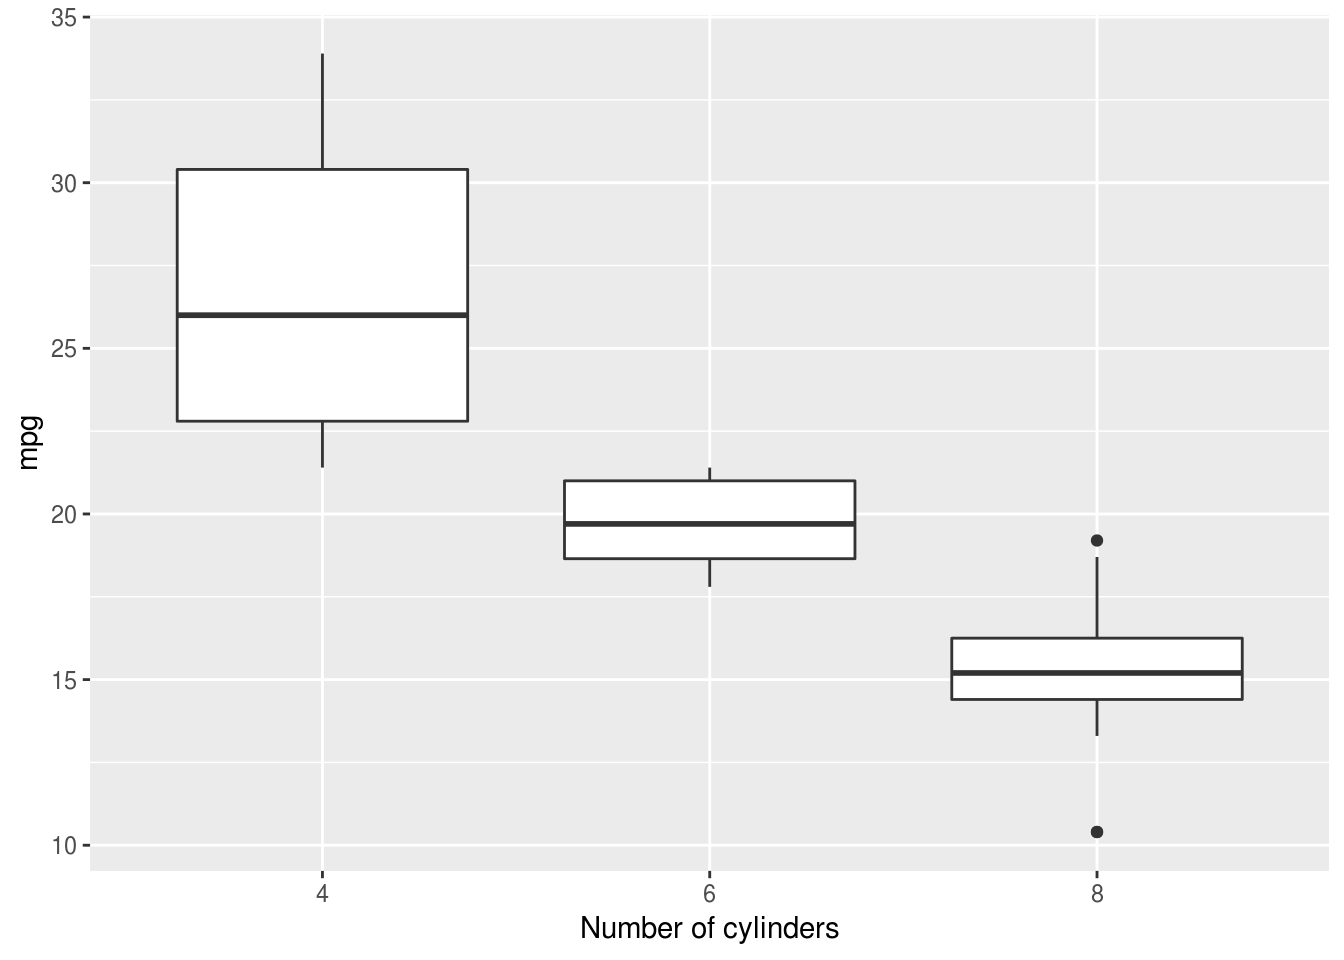
And:
plot.wt + myplotsettings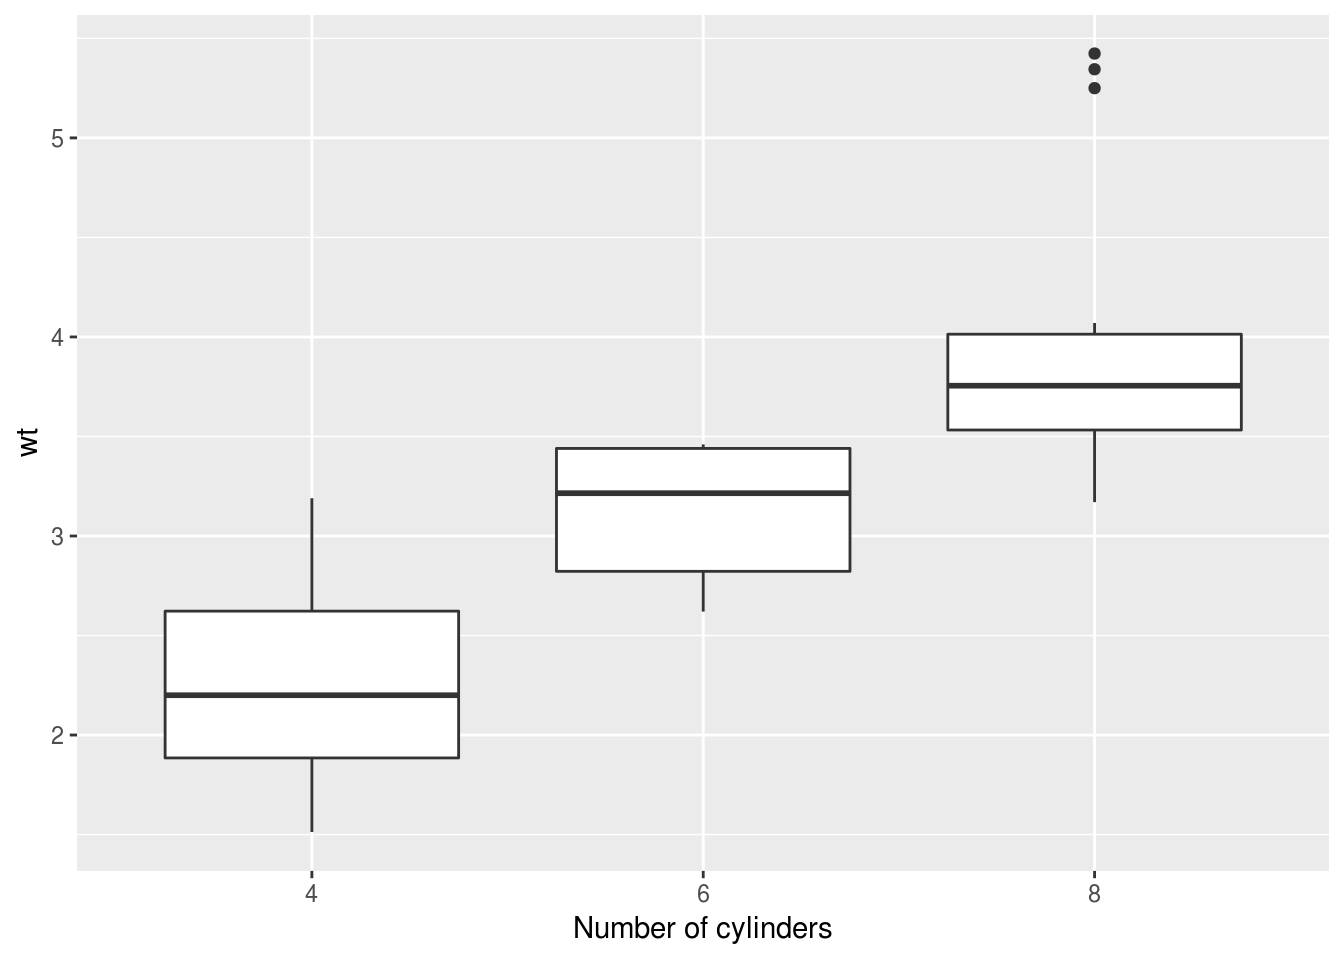
This reduces typing and makes easier to produce a consistent set of plots.