APA formatting for free
A neat trick to avoid fat finger errors is to use functions to automatically display results in APA format. Unfortunately, there isn’t a single package which works with all types of model, but it’s not too hard switch between them.
Chi2
For basic stats the apa:: package is simple to use. Below we use the
apa::chisq_apa() function to properly format the results of our chi2 test
([see the full chi2 example]#crosstabs)):
lego.test <- chisq.test(lego.table)
lego.test

    Pearson's Chi-squared test with Yates' continuity correction

data:  lego.table
X-squared = 11.864, df = 1, p-value = 0.0005724
And we can format in APA like so:
apa::apa(lego.test, print_n=T)
[1] "$\\chi^2$(1, n = 100) = 11.86, *p* < .001"
or using apastats:: we also get Cramer’s V, a measure of effect size:
apastats::describe.chi(lego.table, addN=T)
[1] "$\\chi^2$(1, _N_ = 100) = 11.86, _p_ < .001, _V_ = .34"
17.0.0.1 Inserting results into your text
If you are using RMarkdown, you can drop formatted results into your text without copying and pasting. Just type the following and the chi2 test result is automatically inserted inline in your text:
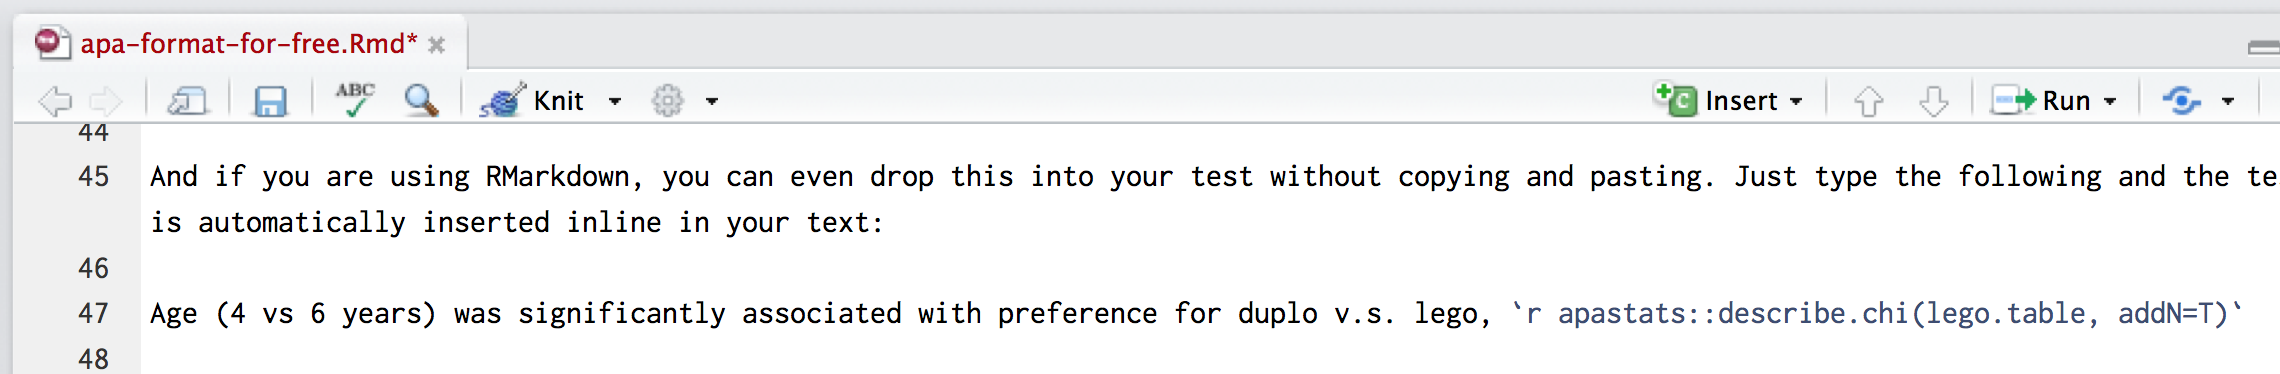
Example of inline call to R functions within the text. This is shown as an image, because it would otherwise be hidden in this output (because the function is evaluated when we knit the document)
Age (4 vs 6 years) was significantly associated with preference for duplo v.s. lego, \(\chi^2\)(1, N = 100) = 11.86, p < .001, V = .34
T-test
# run the t test
cars.test <- t.test(wt~am,data=mtcars, var.equal=T)
cars.test

    Two Sample t-test

data:  wt by am
t = 5.2576, df = 30, p-value = 1.125e-05
alternative hypothesis: true difference in means is not equal to 0
95 percent confidence interval:
 0.8304317 1.8853577
sample estimates:
mean in group 0 mean in group 1
       3.768895        2.411000
And then we can format as APA
apa::apa(cars.test)
[1] "*t*(30) = 5.26, *p* < .001, *d* = 1.86"
American cars were significantly heavier than foreign cars, mean difference=1358lbs; t(30) = 5.26, p < .001, d = 1.86
Anova
mpg.anova <- car::Anova(lm(mpg~am*cyl, data=mtcars))
Registered S3 methods overwritten by 'car':
  method                          from
  influence.merMod                lme4
  cooks.distance.influence.merMod lme4
  dfbeta.influence.merMod         lme4
  dfbetas.influence.merMod        lme4

# extract and format main effect
apastats::describe.Anova(mpg.anova, term="am")
[1] "_F_(1, 28) = 4.28, _p_ = .048"

# and the interaction
apastats::describe.Anova(mpg.anova, term="am:cyl")
[1] "_F_(1, 28) = 3.41, _p_ = .076"
There was no interaction between location of manufacture and number of cylinders, F(1, 28) = 3.41, p = .076, but there was a main effect of location of manufacture, F(1, 28) = 3.41, p = .076, such that US-made cars had significantly higher fuel consumption than European or Japanese brands (see [Figure X or Table X])
Multilevel models
If you have loaded the lmerTest package apastats can output either
coefficients for single parameters, or F tests:
sleep.model <- lmer(Reaction~factor(Days)+(1|Subject), data=lme4::sleepstudy)

#a single coefficient (this is a contrast from the reference category)
apastats::describe.glm(sleep.model, term="factor(Days)1")
Loading required namespace: Hmisc
[1] "_t_ =  0.75, _p_ = .455"

# or describe the F test for the overall effect of Days
apastats::describe.lmtaov(anova(sleep.model), term='factor(Days)')
[1] "_F_(9, 153.0) = 18.70, _p_ < .001"
There were significant differences in reaction times across the 10 days of the study, F(9, 153.0) = 18.70, p < .001 such that reaction latencies tended to increase in duration (see [Figure X]).